Best Places to Live in Illinois. . . If You're a Dog

Student project for Graduate Certificate in GIS
Northeastern Illinois University
Concept | Requirements | Preferences | Final Map
Requirements
- Choose the requirements
- Prepare the base layers
- Add the place data
- Prepare the animal abuse data
- Operationalize the first requirement (far from animal abuse)
- Operationalize the other requirements (close to vets and pet care)
1. Choose the requirements
I chose three requirements (which, not surprisingly, are similar to requirements a human might choose):
- Far from crime or in an area with a low crime rate (i.e., animal abuse). A dog likely would prefer to live in an area where there is a lower risk of becoming a victim of violent crime.
- Close to health care (i.e., veterinary services). In case of illness or injury, a dog will need access to a doctor.
- Close to social services (i.e., pet care services such as training, grooming, kennels, pet sitting, and shelters). A dog's human guardian might regard these services essential to caring for a dog and so, by extension, are a dog's requirements too.
The table below describes how I operationalized each of my requirements for the purposes of making a thematic map. Included are data sources and any necessary calculations or preparation of the data.
| Conceptual Requirement* | Operational Method | Source of Data | Calculation/preparation |
|---|---|---|---|
| Far from known animal abuse locations | Places must be at least 5 miles away from any abuse location. Because my data is in the form of actual places, I chose to use distance as my measure (rather than density). Five miles is an arbitrary threshold, but seems reasonable. At first I tried a distance of 10 miles but this excluded all places from the Chicagoland area, so I settled on 5 miles. |
This organization solicits user-contributed location data for abuse incidents. There are over 250 Illinois cases mapped in the animal abuse database (including both alleged abuses and legal convictions). Data currently is provided online as a Google Map but not in tabular format. |
I must manually extract the data from the Web site and convert the data to Excel format. The data consists of specific places with longitude/latitude information; upon import, I can convert the long/lat information to X, Y coordinates using the "Convert to X,Y" function in ArcMap. I then must create a spatial join to calculate distance between abuse locations and places |
Close to veterinary services The distance should be the furthest distance a dog's guardian would be willing to drive for emergency care. |
Places must be in counties that have at least 0.01 veterinary services per square mile. Since the data is for counties (an area), only a density measure is suitable. I arrived at the "0.01" figure only after experimenting with different calculations. This is an arbitrary threshold, but results in a reasonable number of qualifying counties. |
U.S. Census Bureau: 2002 Economic Census (by County) | The data for veterinary services and pet care services are in the same comma-delimited format (.csv) with duplicate rows for "all establishments" and "establishments subject to federal income tax." First I'll have to convert the data to tabular format then delete the duplicate rows. Then I'll have to create separate tables for veterinary services and my third requirement, pet care services, which is provided in the same format. I will join the data to the attribute table for the prepared "county_with_data" layer using "county" as the linking field. The source data includes the word "County" in each county field, but the prepared data omits the word "County". Before making the join, I'll have to edit the county fields in one table or the other to make sure the county name text strings are uniform. I also will create two new fields: veterinary services/square mile and pet care services/square mile for each county. |
Close to pet care services There are fewer pet care services than veterinary services in the U.S. (approx. 8,000 compared to 26,000) so it might be reasonable to expect a dog's quardian to drive further for such a service). |
Places must be in counties that have at least 0.005 pet care services per square mile. Since the data is for counties (an area), only a density measure is suitable. I arrived at the "0.005" figure only after experimenting with different calculations. This is an arbitrary threshold, but results in a reasonable number of qualifying counties. |
U.S. Census Bureau: 2002 Economic Census (by County) | See veterinary services above. |
2. Prepare the base layers
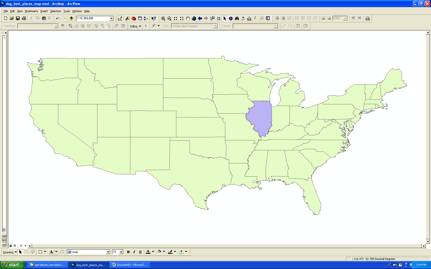
First, I imported the prepared “states” layer:

I imported the Illinois state boundary shape file (obtained from the Illinois Clearinghouse):
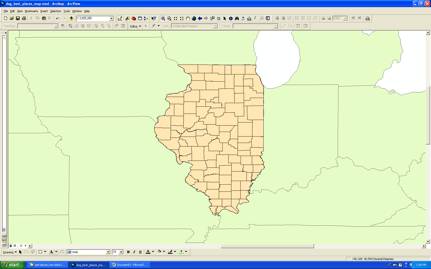
I import the prepared “counties with data” layer. I then select only counties in Illinois and export the selected data as a new shape file that includes only Illinois counties.
In case I decide to use census tracts for my map, I obtain and import census tract shape files for all counties in Illinois from the Census Web page http://www.census.gov/geo/www/cob/tr2000.html. (Apparently, this source has more useful attributes than the files in the TIGER database.)
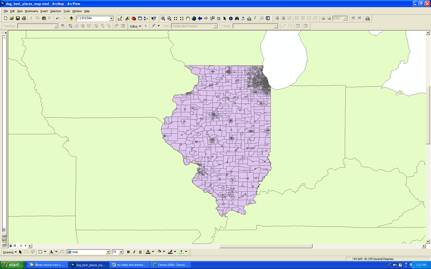
I don’t yet know if I need this layer, so I hide it for now (which also helps speed up my work because the won’t have to “draw” each time I perform task).
3. Add the places data
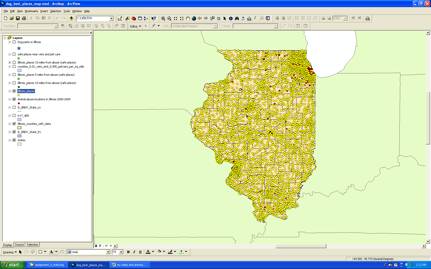
Next I add the prepared “place_points” layer and use the Select by Location function to select only those places within the Illinois boundary layer.
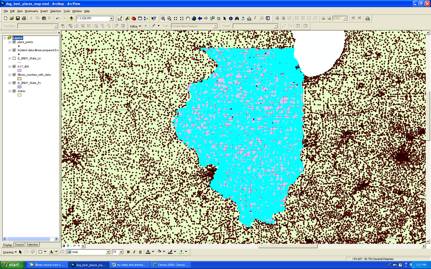
Since I only want to use Illinois places, I export the data as a new shape file that contains only the selected places, then I remove the original “place_points” layer.
4. Prepare the animal abuse data
Next I obtain Illinois animal abuse data from pet-abuse.com, which includes Google map of 276 incidents of abuse (both alleged and confirmed), mostly dating from 2000 to 2009.
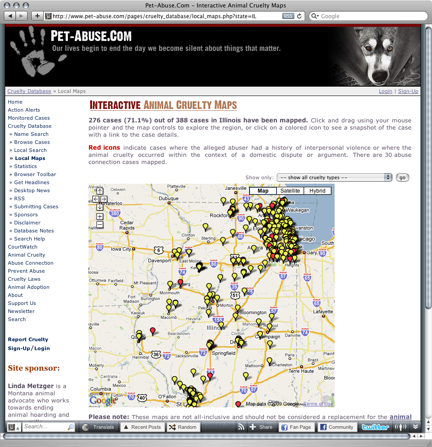
By viewing the HTML source I see that the map data includes comma-delimited data for each abuse location:

I save the data as text, open it Excel, convert the comma-delimited data to columns. The most important data is the longitude/latitude data because this data will determine location on the map, and any required joins can be done as spatial joins based on these coordinates.

I save the data as a .dbf file and add it to my map.
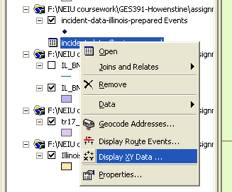
To get the points to appear on my map, I have to right-mouse click on the table icon and select “Display XY Data”.
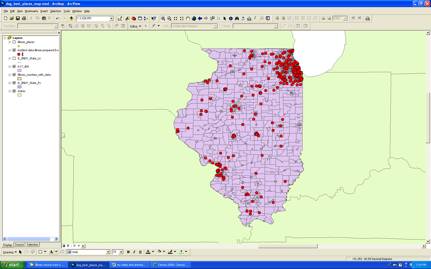
This converts the longitude/latitude data to x, y coordinates that can be displayed in my map (red-colored ponts):
5. Operationalize the first requirement (far from animal abuse)
According to my first requirement, I want to eliminate places that are close to animal abusers. I can either select the places manually or join the abuse layer to the places layer. I’ll perform both methods since I’ve never done a spatial join. Also, a joined layer might come in handy for the preferences step of the project should I decide to reuse the abuse data to refine the selection.
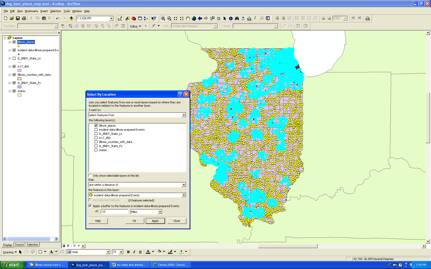
First I use Select by Location to select all places “within a distance of 10 miles” of an incident of animal abuse.
Then I switch the selection to show only those places outside of the 10 mile buffer…
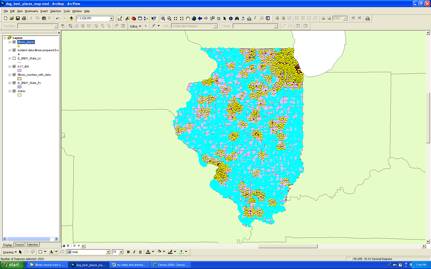
… and create a new layer for those places (shown in green).
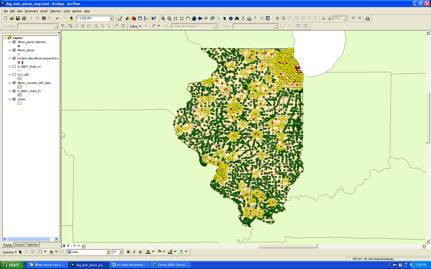
I decide to reduce the buffer to 5 miles since the 10 mile buffer excludes Chicago and every place in the surrounding countries. The 5 mile buffer allows for a handful of places in the Chicago area (or at least the surrounding counties).
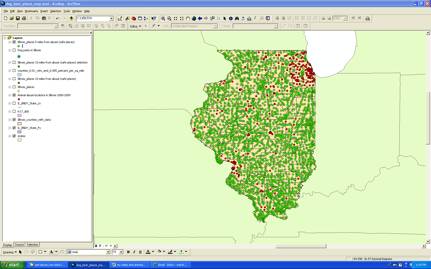
Now I’ll perform the spatial join.
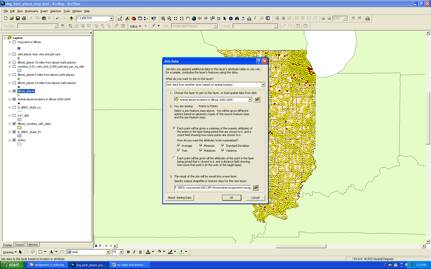
There are two options in the dialog box. One option creates count and count-derived data, the other distance data. I’ll do both.
First, the count-related option:
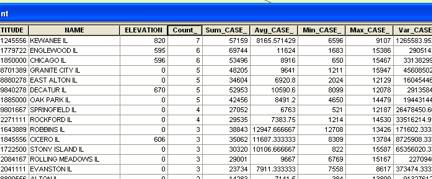
The resulting attribute table is useful because it shows me which cities have the greatest number of abuse incidents.
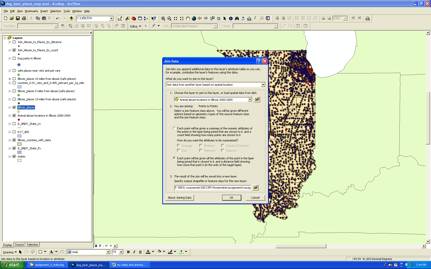
Now I’ll join the layers using the distance option:
The resulting attribute table shows the closest incident of abuse for each city in the original places layer:

Theoretically I could use this data to select all places that have abuse incidents a certain distance away. Unfortunately the unit of distance is decimal degrees. To make this calculation more user friendly (e.g., for a legend or other use), I will have to find a way to convert the unit of distance to miles. I will make this conversion later (in the Preferences phase of project). For now, I decide to hide my spatially-joined layers and proceed with my manually joined layer.
6. Operationalize the other requirements (close to vets and pet care)
Next I have to incorporate my other two requirements: close to veterinary establishments and close to pet care services.
I prepare the Veterinary Establishments Excel file, create a .dbf version, and then join it to the existing county layer.
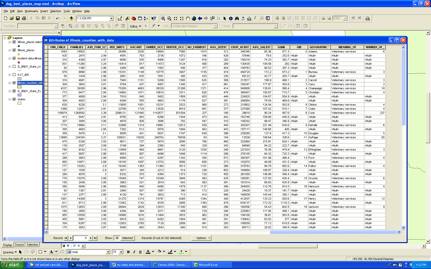
I then create a new field to calculate the number of veterinarian establishments per square mile in each county:
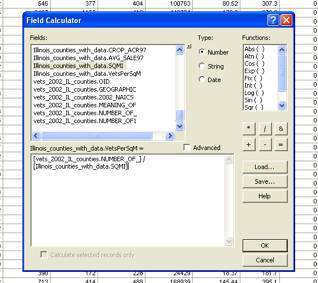
I repeat the process for Pet Care and end up with calculations for
- veterinary establishments per square mile
- pet care services per square mile
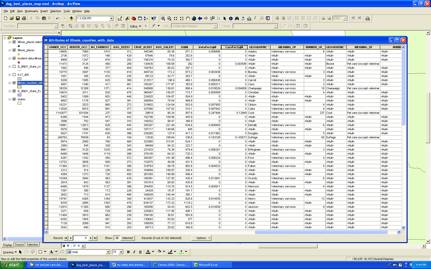
Now I can use a series of selection methods to further eliminate places from the map.
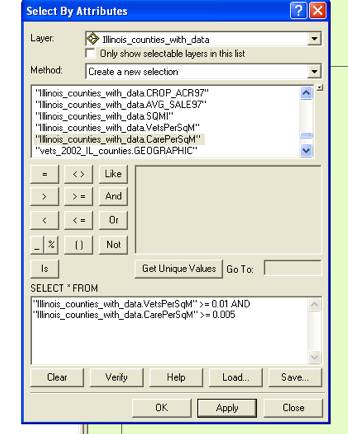
I use Select by Attributes to narrow down the counties with the highest veterinary establishments and pet care services per square mile. I use the Boolean term “AND” to find counties that meet both requirements. After some experimentation, I choose a threshold of 0.01 veterinary practices per square mile and 0.005 for pet care services so that I have a reasonable number of counties.
I create a new layer based on this county selection:
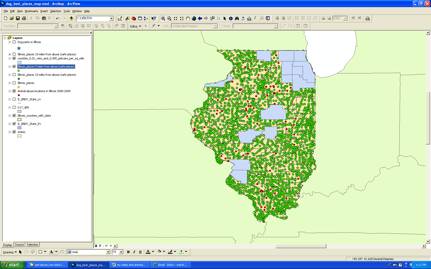
I then use Select by Location to narrow my selection of places that are far from abuse (“safe places”) to only those counties that are within the counties previously selected.
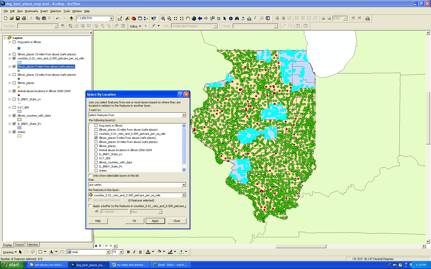
And I create another layer for just those places.
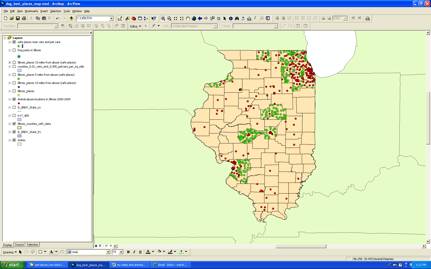
I have operationalized all of my requirements to create a layer of “qualifying places.” The next step is to create preferences to further refine the qualifying places.
→ Go to Preferences