Best Places to Live in Illinois. . . If You're a Dog

Student project for Graduate Certificate in GIS
Northeastern Illinois University
Concept | Requirements | Preferences | Final Map
Final Map
- Calculate a "score" for each of the qualifying places
- Choose a classification method and symbology
- Lay out and publish the final map
1. Calculate a "score" for each of the qualifying places
All four preferences have been operationlized but, because each place has a different value for each of the preferences, there is no clear "winner" among the places. For example, one place might have a high income score but is far away from a dog park. So how does one know which place is better than another given these widely varying values? The only way to answer this question is to create a single "score" that can be used to sort the places in rank order.
The following formula is used to calcuate the score:
(((P1-AvgP1)/StDevP1)*W1)+(((P2-AvgP2)/StDevP2)*W2)-(((N1-AvN1)/StDevN1)*WN1)
where "P" indicates positive items (i.e., better when values are large), "N" negative items (i.e., better when values are small), "W" weights, "Avg" is the average value, and "StDev" is the standard deviation.
In my final attribute table, the preferences are represented by these fields:
- INCOME (large is better, hence a positive variable)
- ABUSEDISTANCE (large is better, hence a positive variable)
- DOGPARKDISTANCE (small is better, hence a negative variable)
- PARKDISTANCE (small is better, hence a negative variable)
Using these preferences, I created a new field called "Score" that calcuates the score as follows:
(((INCOME-AvgINCOME)/StDevINCOME)*WINCOME)+(((ABUSEDISTANCE-AvgABUSEDISTANCE)/StDevABUSEDISTANCE)*WABUSEDISTANCE)-(((DOGPARKDISTANCE-AvgDOGPARKDISTANCE)/StDevDOGPARKDISTANCE)*WDOGPARKDISTANCE)-(((PARKDISTANCE-AvgPARKDISTANCE)/StDevPARKDISTANCE)*WPARKDISTANCE)
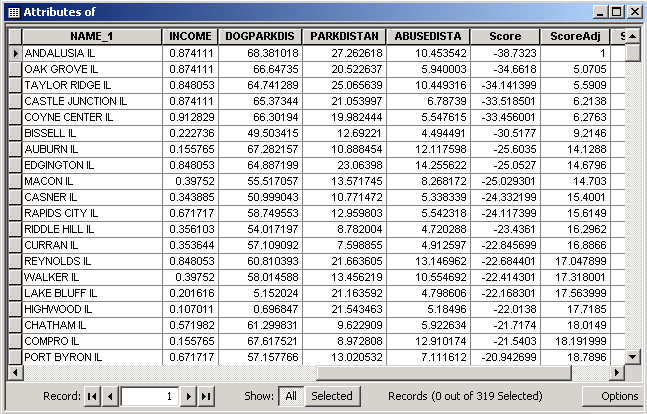
Because many of the scores are negative numbers, I decide to create another field, "ScoreAdj," that adds the lowest value to all values, plus "1", to make all scores a positive number.
Here is the resulting attribute table:

2. Choose a classification method and symbology
Now I must classify and symbolize the qualifying places for my map.
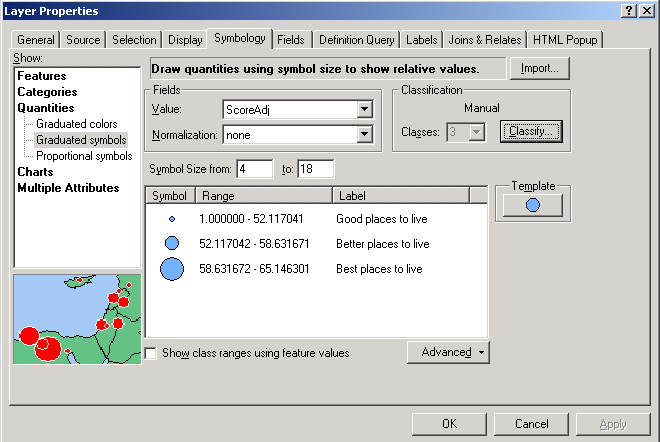
I decide to use a manual classification method to divide the places into a simple three-tiered classification system with value breaks determined by percentage:
- good = below 80%
- better = 80%–90%
- best = 90%–100%

Because my place data are represented as points, I decide to use graduated symbols for their symbology. (The data is not based on area, so a choropleth symbology would not be appropriate.) I choose a medium blue color and adjust the symbol size so that a map user can easily distinguish the three classes, while keeping the largest dot small enough (18 pt) to not overwhelm the other dots:

3. Lay out and publish the final map
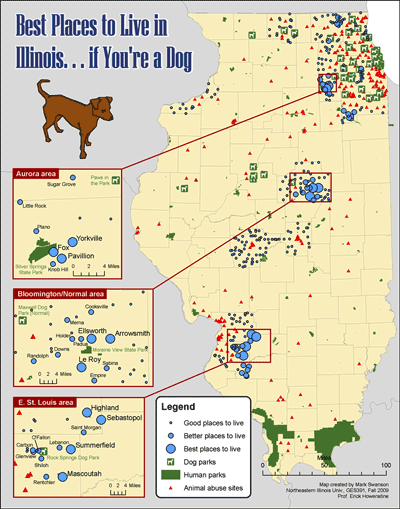
Now I can lay out my map. I choose colors and symbols for the other layers: green for parks, green "dog" icon for dog parks, and red triangles for animal abuse sites. Looking at my qualifying places, I notice that the "best" class includes 10 places in three clusters, located in very disparate parts of the state: the Aurora area, the Bloomington/Normal area, and the East St. Louis area. I decide to create three insets to better show the details of those areas. I adjust the extent of these insets to closely frame the 10 "best" places and the nearest dog park. To emphasize the "best" places (the subject of the map) I label them in 14 point text. I label "better" places, dog parks and human parks in 10 point text. Differently-sized text is logical since it corresponds to differently-sized symbols. What do I do about "good" places? Ideally I would label them too, but there are so many of them that labels would create clutter. I decide omitting labels for "good" places is a necessary tradeoff between map legibility and comprehensiveness.
Before I export the map, I change the data frame's projection to an Illinois state plane projected coordinate system so that the state no longer looks "tilted."
Here is the final map (click to enlarge):
