Best Places to Live in Illinois. . . If You're a Dog

Student project for Graduate Certificate in GIS
Northeastern Illinois University
Concept | Requirements | Preferences | Final Map
Preferences
- Choose the preferences
- Convert data frame to equidistant projection
- Operationalize the preference "Far from animal abuse"
- Operationalize the preference "Near a dog park"
- Operationalize the preference "Near a human park"
- Operationalize the preference "Sufficient human income"
- Prepare a single attribute table for preferences
1. Choose the preferences
My preferences will be criteria that can be used to index the qualifying places in rank order (from best to worst). They will not exclude any place from the selection.
I have chosen four preference categories:
- Dog parks. These are parks where humans can take dogs to exercise, run freely and socialize with other dogs. Dogs parks probably are located in more affluent communities and some might require fees, so this criterion could never be a requirement, but places near a dog park are more desireable than places not near one.
- Human parks. These are parks created for human recreation where humans can take their dogs for walks. They might include city parks as well as natural/wild parks with trails (e.g., State Parks). Places close to a human park are more desirable than places far from one.
- Human income level. A dog's human guardian should have sufficient income to pay for all the expenses associated with a dog's care (veterinary care, pet care services, food, etc.). While affluent humans are not necessarily better animal guardians, a certain minimum income is preferable. I can give preference to middle and higher incomes (say, over $40,000), by favoring areas where these income levels are more prevalent.
- Distance from known animal abuse locations. This preference refines a requirement. The assumption is that, given a choice, a dog would prefer to live in a place furthest from areas of known abuse.
The table below describes how I will operationalize each of these preferences. Included are data sources, weights (on a scale of 1 to 10), and data preparation notes. I give the highest weight to dog parks because they offer greater socialization opportunities for dogs than human parks. Giving parks higher weights is based on the assumption that outdoor recreation, exercise and socialization are daily needs regardless of income or distance from known abusers.
| Preference | Operational Method | Source of Data | Weight | Preparation/calculation |
|---|---|---|---|---|
| Near a dog park | Distance from place point to dog park point (shorter is better) |
Calculation via spatial join |
10 | Distance calculated by joining dog parks + places layers. |
| Near a human park | Distance from place point to park centroid (shorter is better) |
Provided data Calculation via spatial join |
8 | Distance calculated by joining human parks + places layers. |
| Sufficient human income | Median household income for surrounding census tract (% of households whose income is $40,000 or above; higher percentage is better) |
U.S. Census Bureau (2000 Census for Illinois census tracts)
|
4 | First I must join attribute tables of the provided data layer with another census data file I downloaded that includes income. Then, for each tract, I calcuate the total number of households with income over $40,000. Then I divide that result by total number of households in the tract to obtain a percentage. |
| Far from known animal abuse locations | Distance from place point to abuse location point (longer is better) |
Calculation via spatial join |
6 | Distance calculated by joining abuse locations + places layers. |
2. Convert data frame to equidistant projection
Recall that, while creating my requirements, I discovered that the unit of measure for my layers was “decimal degrees," which does not allow for distance measurements in miles. To measure distance in miles, I must convert my map’s data frame to an equidistant projection (USA Contiguous Equidistant Conic), specifying “miles” as the map’s unit of measure. This allows me to perform calculations or recreate layers that might require distance measurements in miles.
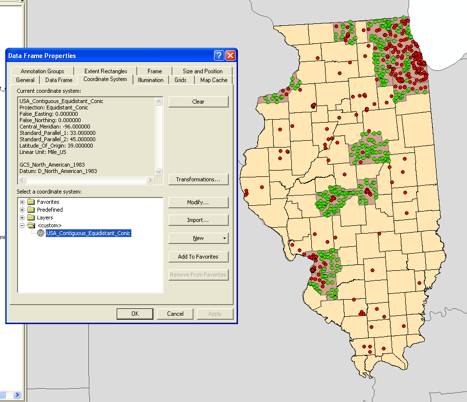
(The projection “tilts” the state of Illinois to the left, but I can re-orient the state before I layout my map by re-assigning an equal area projection to the data frame.)
3. Operationalize the preference "Far from animal abuse"
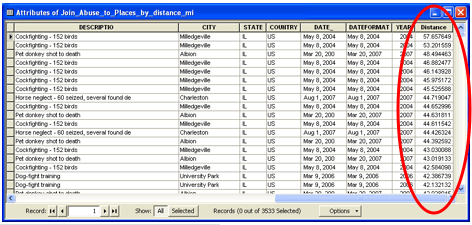
Here is a newly-created joined spatial layer for abuse locations and places, now with miles as the distance unit (rather than decimal degrees). I use the "Distance" field to operationalize my preference, “Far from abuse locations.”
4. Operationalize the preference "Near a dog park"
For my preference, “Near a dog park,” I obtain the data for dog parks from the Web site http://www.dogparkusa.com/. The Web site features a Google map for each state, with location place markers for each dog park. The data is not available for direct download, but it can be accessed by viewing the source HTML:
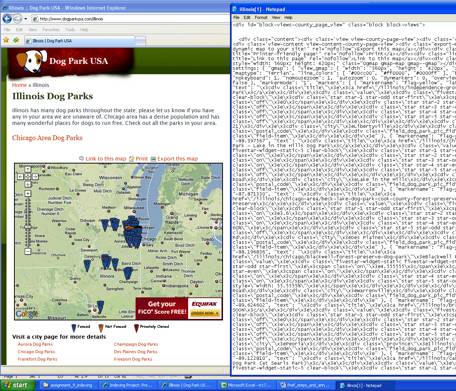
I save the HTML file to my computer. Since the code is not delimited, I have to create a data file manually. I first open the HTML file in Dreamweaver, where I tweak the code to make it easier to scan visually for relevant text.
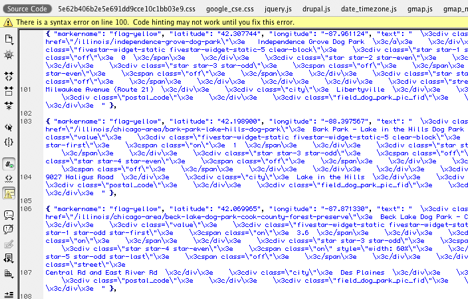
For all 51 Illinois dog parks, I copy and paste seven separate text strings (name, city, longitude, latitude, etc.) into an Excel file, making sure that each piece of data is in its own column.
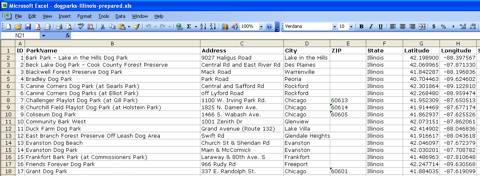
I can then import the data file into my map.
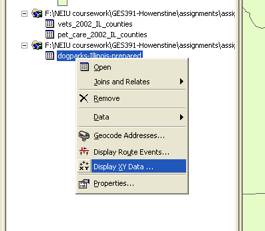
Because the data is in longitude/latitude only, I must convert it to x,y format using the “Display XY Data” function.
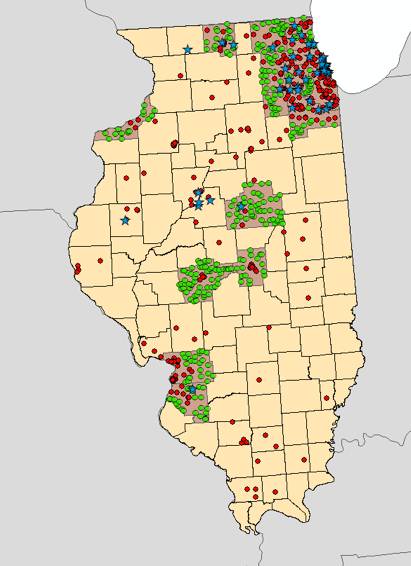
The dog parks appear on their own layer (indicated here by blue stars):
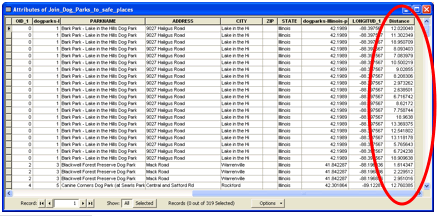
I then use a spatial join to join the data from the dog park layer to the safe places layer. This creates a distance field that I can use to operationalize the preference “near a dog park.”
5. Operationalize the preference "Near a human park"
I then load the prepared “parks” layer, selecting only those parks that intersect the Illinois area.
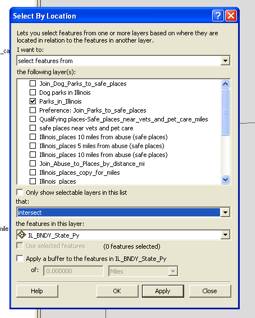
I export the selection as a new layer. I delete wildlife refuges, conservation areas and historic sites from the attribute table because dogs generally are not allowed in such areas.
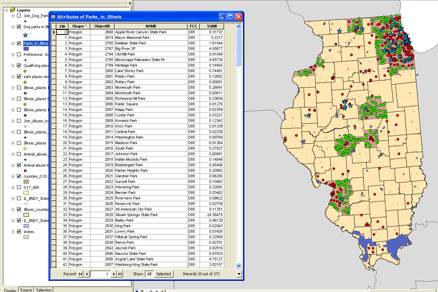
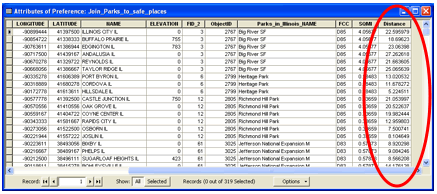
I spatially join the provided Parks layer to the “safe places” layer (the layer of qualifying places based on the requirements), resulting in a new attribute table with a distance calculation that I can use to operationalize my preference, “near a human park.”
6. Operationalize the preference "Sufficient human income"
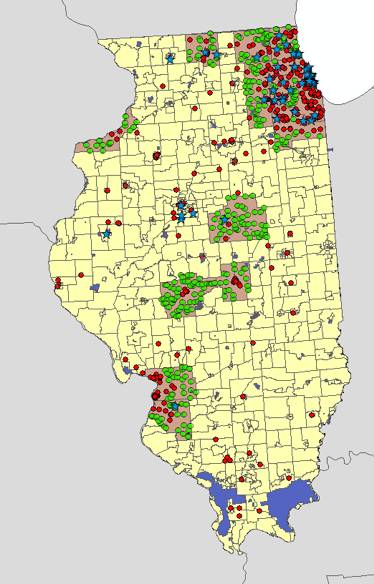
I decide to use census tracts instead of counties because they will provide more detail within a county. I activate the tracts shape layer I had created earlier. The tracts appear in yellow with gray boundaries.
Since the tracts attribute table doesn’t include income, I have to obtain income data from the U.S. Census for all Illinois tracts.
My preference stipulates that I favor census tracts in which the highest percentage of households has an income of at least $40,000. This information is not provided directly in the census data, so I have to prepare the Excel file by creating two new calculation fields:
- Households with income $40,000 or higher
- Percentage of households with income $40,000 or higher
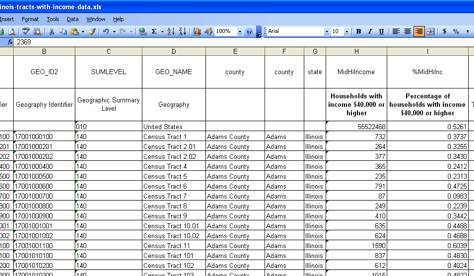
My goal is to join this new data with the attribute table for the tract shape file. But because the tract ID numbers are not formatted in the same manner, I have to modify the shape file’s table in Excel by creating new tract numbers that match the 11-digit numbers from the Census file. It’s a three step process. First, I have to distinguish 4 digit tracts from 6-digit tracts, so I create a length field. Second, I use an If/Then logic rule, along with the concatenate function, to add “00” to all the 4-digit tracts. Finally, I concatenate the three text strings (State code + County code + tract code) to create the same 11-digit code in the other Census data.

To join the income data to my tract shape file, I have to perform two joins.
First, I import the modified shape file table into my map file then join it to the original shape file table:
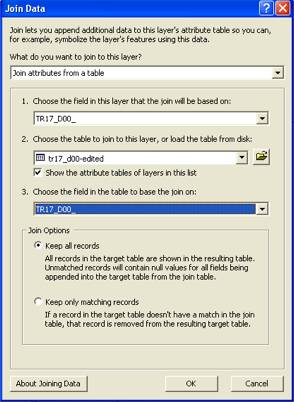
Second, I finish preparing the tract income table (by removing the extraneous header), import it into the map file, then join it to the tract spatial layer. Here is the resulting table:

To give myself some flexibility when I later apply my preferences, I select only those tracts that contain my qualifying places and export a layer based on the selection.
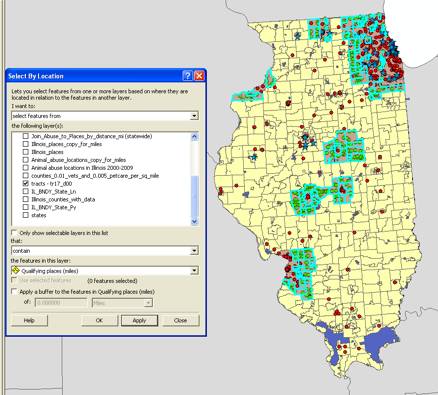
7. Prepare a single attribute table for preferences
I have to prepare my preference data to join it to my base layer of qualifying places. I prune each of my four preference attribute tables to make the joining process easier. I make sure to leave a linking field (“NAME”) in place:
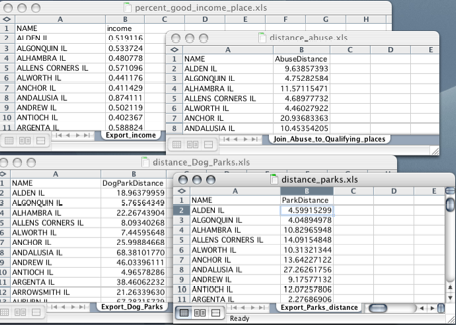
I then create a single Excel file that contains all four preference calculations, making sure to keep them in sort order (by Name):
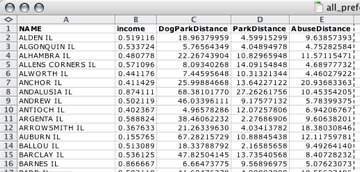
I then import this Excel file into my map.
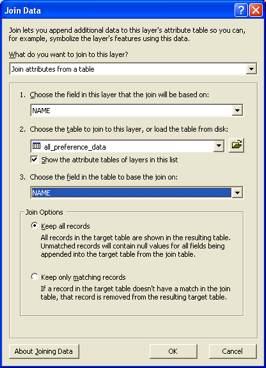
Now I have to join the first table to the base layer, using “Name” as my linking field. ArcMap won’t permit me to join the table to my “qualifying places” layer exported from the original layer (the one I created to match the projection of the data frame), so I have to join the data to the original layer.
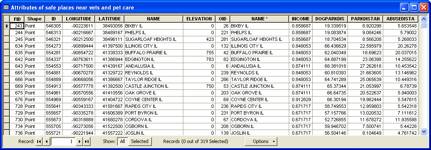
The resulting attribute table includes all the preference data:
To retain the equidistant projection of the data frame, I re-export this layer’s data to create a new layer called “Qualifying Places with Preferences.”
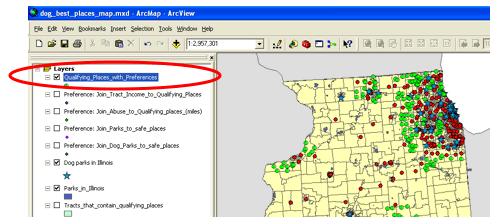
Here is the attribute table for the “Qualifying Places with Preferences” layer, with the preference data highlighted:
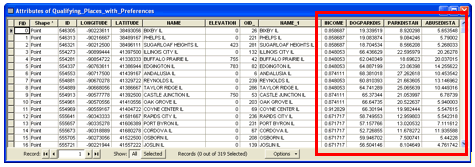
This is the attribute table I will use to create my “final score” calculations for the published map.
→ Go to Final Map